Plantebaserede fødevarer
Tilhører:
Plantebaserede fødevarer og drikkevarer
Indeholder:
- en:Bran
- en:Canned plant-based foods
- Korn og kartofler
- en:Cheese substitutes
- Kaffe
- en:Coriander products
- en:Culinary plants
- en:Dried plant-based foods
- en:Egg substitutes
- en:Elderberry products
- Fennikel
- en:Fenugreek products
- en:Flakes
- Mel
- en:Freeze-dried plant-based foods
- en:Fresh chervil
- en:Fresh plant-based foods
- en:Fried plant-based foods
- en:Frozen plant-based foods
- Frugt- og grøntsagsbasere fødevarer
- en:Fruits-Nuts-Seed variety packs
- en:Herbs/Spices/Extracts Variety Packs
- Bælgplanter og -produkter
- en:Liquorice roots
- en:Nutmeg tree products
- Nødder og nøddeprodukter
- en:Olive tree products
- en:Pan-fried vegetables
- Pasta
- Syltede agurker
- en:Plant-based creams
- en:Plant-based meals
- en:Plant-based pickles
- en:Plant-based spreads
- en:Potted plants
- en:Powdered plant milks
- en:Prepared vegetables
- en:Psyllium
- en:Puffed grains
- en:Pumpkin and Squash plant products
- en:Refrigerated plant-based foods
- en:Seaweeds and their products
- Frø
- Ikke-grønne plantedele krydderier
- en:Sprouts
- en:Starches
- en:Stevia and their products
- en:Sunflower seeds and their products
- en:Vegetable broths
- Vegetabilske fedtstoffer
- fr:Cerfeuil tubéreux
- nl:Seroendeng
Ernæringsfakta
Gennemsnitlige næringsindhold for 512-produkterne i Plantebaserede fødevarer-kategorien, for hvilke næringsindhold er kendt (ud af 623 produkter).
| Ernæringsfakta | Ved salg pr. 100 g/100 ml |
Standardafvigelse | Minimum | 10. centil | Median | 90. centil | Maksimum |
|---|---|---|---|---|---|---|---|
| Energi |
1.240 kj (298 kcal) |
657 kj (157 kcal) |
0 kj (0 kcal) |
219 kj (52 kcal) |
1.320 kj (316 kcal) |
2.470 kj (590 kcal) |
3.770 kj (909 kcal) |
| Fedt | 10,2 g | 14 g | 0 g | 0,3 g | 3,4 g | 48,9 g | 217 g |
| Mættede fedtsyrer | 1,98 g | 2,91 g | 0 g | 0 g | 0,6 g | 8,7 g | 93,3 g |
| Enkeltumættede fedtsyrer | 5,36 g | 7,82 g | 0 g | 0 g | 1,2 g | 28 g | 76 g |
| Flerumættede fedtsyrer | 3,72 g | 6,13 g | 0 g | 0,1 g | 0,8 g | 19 g | 31 g |
| Kulhydrat | 35,6 g | 24,3 g | 0 g | 3,5 g | 37 g | 72 g | 97 g |
| Sukkerarter | 7,48 g | 10,4 g | 0 g | 0,5 g | 3,4 g | 35 g | 89 g |
| Kostfibre | 5,64 g | 3,89 g | 0 g | 0,6 g | 5,4 g | 13,4 g | 51 g |
| Protein | 7,45 g | 5,67 g | 0 g | 0,5 g | 7 g | 19 g | 80 g |
| Salt | 0,599 g | 0,606 g | 0 g | 0 g | 0,51 g | 1,7 g | 56 g |
| Alkohol | 0 % vol | 0 % vol | 0 % vol | 0 % vol | 0 % vol | 0 % vol | 0 % vol |
Land: Danmark - Vis matchende produkter fra hele verden
624 produkter
-
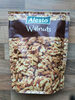
Walnuts - ALESTO - 200g
-
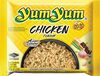
Instantnudeln - Chicken Flavour - YumYum - 60g
-
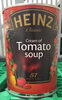
Cream of Tomato Soup - Heinz - 400g
-
Organic Vegan Block - Naturli - 200g
-
Glutenfri pasta - Barilla - 400g
-
Premium Tortellini Ricotta & Spinach - Chef Select - 250 g
-
SCHAR - Fette crocantinis schar - Schär - 4
-
Pizzasauce Aromatica - Mutti - 400 g

-
Fitness - Nestlé - 375 g
-
YumYum - Beef Flavor - 60 g

-
Tomaten geschält ganz - Mutti - 400g
-
Kokosmel - Belbake - 250 g
-
Fusilli n°34 - De Cecco - 500g
-
Penne rigate nº 41 - De Cecco - 500g
-
Vegetable stock - Kania - 120g (12 x 10g)
-
White Asparagus - Freshona - 0g
-
Buldak Hot Chicken Flavour Ramen 2x spicy - Samyang - 140 g

-
Wraps, Gluten-free - Schär - 160g
-
Lipton Earl Grey 25 Sachets - 40 g e (25 sachets)

-
Creamy with garlic & herbs - Violife - 150g

-
Thin Crisp - Rivercote - 300 g

-
Cornflakes - Kellogg's - 500g

-
Gnocchi - De Cecco - 500g

-
Langkorn Parboiled Spitzenreis - Golden Sun - 750g
-
Bellarom Gold - B - 500g
-
Sliced Champignons - Freshona - 170 g
-
Cashew - Raw-Bite - 50 g

-
Ananas in Scheiben - Del monte - 0.565kg

-
Sauerteigbrot mit Preiselbeeren - Schär - 240 g
-
SESAM - Wasa - 200 g
-
Breadcrumbs - Bellbake - 500g
-
Oatly Barista Edition - 1l

-
Caramel almond & sea salt - Be-Kind - 3 x 30 g
-
Gazpacho - U Bio - 75 cl
-
F-musli Guld - Axa - 750 g
-
Husman - Wasa - 520g
-
Nordic Oat Drink - Jörd - 1L

-
Farfalle - De Cecco - 250g
-
Cream of Tomato - Baxters - 400 g

-
Corn Flakes - Crownfield - 850 g
-
Haricots rouges kidney - Bonduelle - 310 g (égoutté : 250 g)
-
Sesam & Havsalt - Wasa - 290g
-
Waitrose
-
Kærgården - Arla - 200 g

-
Sopa Juliana - Trevijano - 100 g
-
Solsikkerugbrød - Schulstad - 950 g

-
mie noodles - Go tan - 250 g
-
Oat Barista Creamer - Naturli’ - 1L
-
Rice & Corn Cakes Paprika BBQ - Good Food - 134 g
-
Plant based pizza Mexicana - Naturli - 350 g

-
Nesquik - Nestlé - 375 g

-
Sandwich Rugbrød - Schulstad - 810g

-
Økologisk Havredrik - Spir - 1 l
-
350 g

-
COCA COLA CHERRY - 330ml

-
BioKitchen Organic Peanut Butter Smooth - Clearspring - 350 g
-
Choco Krispies - 600g

-
Risotto Mediterráneo - Trevijano - 280 g
-
Signaturbrød - Schulstad
-
Havre Drik - Naturli - 990 ml
-
Oatly Økologisk Havre Drikk - 1L

-
Organic Peanut Butter Crunchy - Clearspring - 350 g
-
Kernegrov - levebrød - 950 g
-
Nescafe gold - Nescafé Nestlé - 200 g

-
Green Dates Juicy Dates(Mazafati) - RM Import
-
No added sugar Crunchy Müsli, Apricot&Pumpkin seeds - W.K. Kellog - 400 g
-
Crunchy müsli - kellogg-s - 8 x 45 g
-
Lebanese Style Falafel - AL'FEZ - 150 g

-
Crunshy Müsli - Kellogg's - 400 g
-
Lion 2PK 60G

-
Wasa Eko krispig råg - 180 g
-
Fusilli - Combino - 1 kg
-
Knäckebrot Wholegrain Rye Crispbread - Rivercote - 250 g
-
Apfelstrudel - Alpen Fest - 375g
-
Vegane Knackies aus Saitan - Alnatura - 200 g
-
wasa glutenfri laktosfri naturell - 240 g
-
Crunchy Müsli Choco Nuts - Kellogg's
-
Risotto de Hongos - Trevijano - 280 g
-
Tee - Nescafé - 159.2g

-
Vollkornbrot - Schär - 250 g
-
Boisson Amande Calcium - Ecomil - 1 l
-
Capsules NESCAFE Dolce Gusto Latte Macchiato 16 Capsules - Nescafé - 194.4 g
-
Vinaigre de tomate - Mutti - 500 ml.

-
L'OR Latte Macchiato Caramel Coffee Pods 8 Servings - Tassimo - 271.2 g

-
Confiture Extra Schwarzkirsche - Schwartau - 340g
-
Croc'miel - Lucien-georgelin - 375 g
-
Superfood Crunchy Müsli - Cranberry & Lindseed - W.K. Kellogg - 400 g
-
Figenbrød med Mandler - Corona Blanca - 250 g

-
Special K - Red Berries - Kellogg's
-
Weetos - Anneaux Multi-Céréales - Weetabix - 375 g
-
Pan carré - Schär - 400g
-
Barista - Nescafé Dolce Gusto - 120 g

-
Tortilla Original - Santa Maria - 320 g
-
Baguette - Coop - 415g
-
Proteinbrød - Kohberg - 450g
-
ristet crunchy havre - Axa - 750 g
-
Chia Boller - Schulstad

-
Finvalsede havregryn - Rema 1000 - 1 kg
-
Havregryn finvalsede - Salling - 1 kg

-
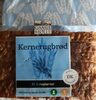
Kernerugbrød - Birkelund